BeautifulSoup of Sport
Python package for parsing HTML and XML code for web scraping
![]()
![]()
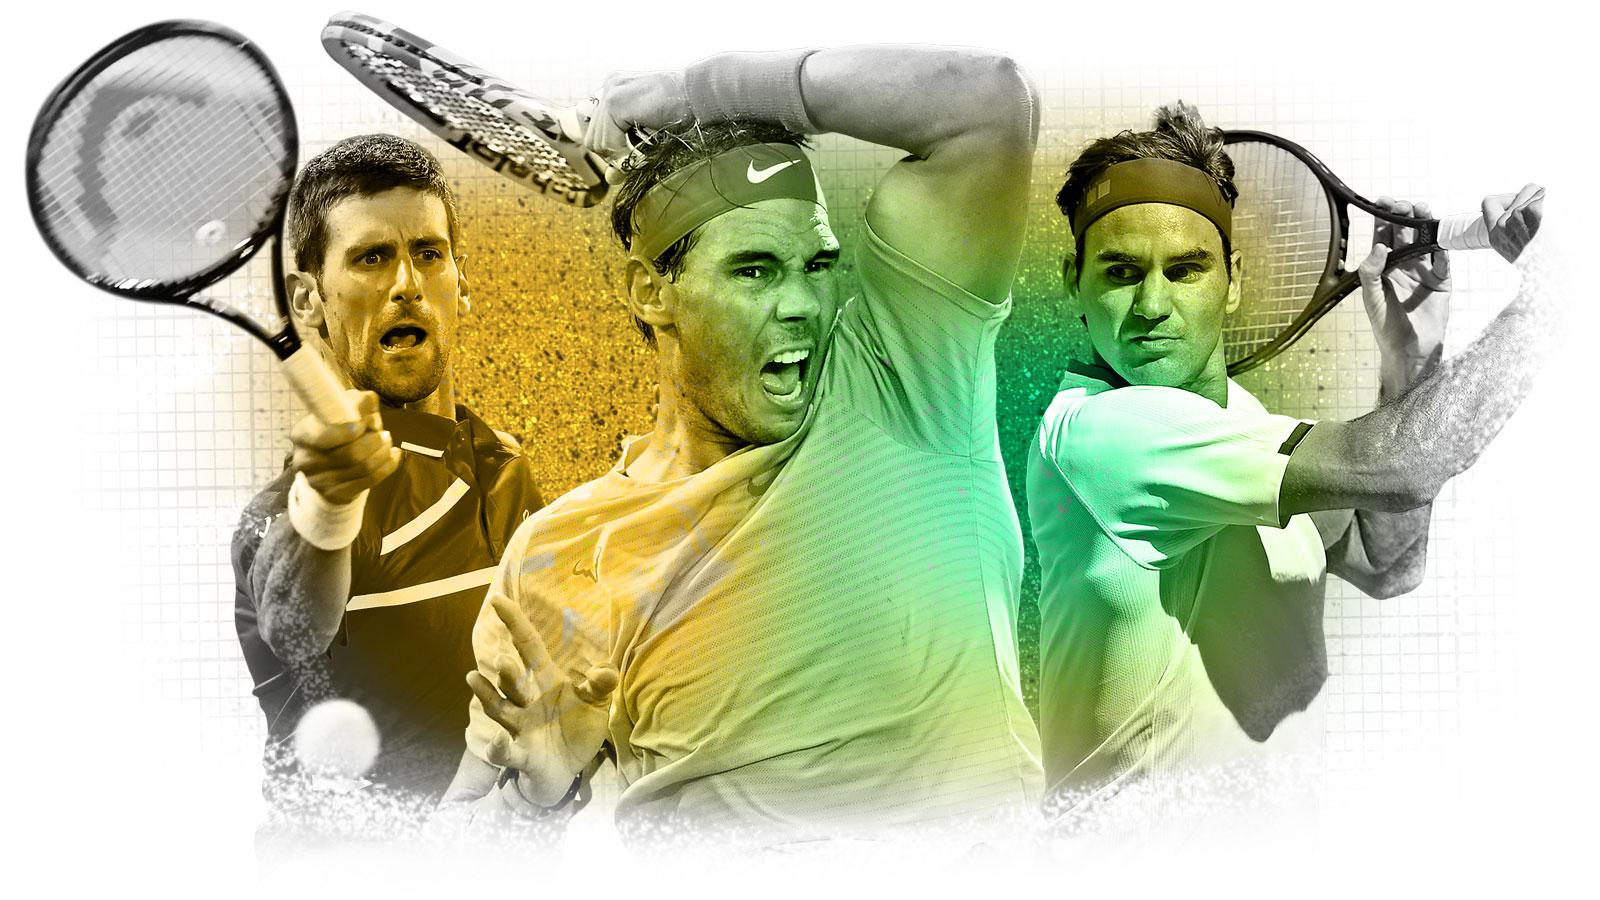
The Big Three
2008 was the year when I was introduced to Tennis. I was familiar to the sport and knew name of famous tennis athletes but never closely followed it. During Wimbledon Tournament, clearly the top two players Federer and Rafa were going to face each other at finals, it was the most anticipated match, and I was onboard with the hype for two reasons :
- Roger Federer was chasing history. If he won he would tie with Pete Sampras for most grand slams (14) in Mens Tennis. Federer currently has 20 slams in his bag, for majority of his career he has been in the lead, until year 2020 when Rafa won his 20th slam.
- Rafael Nadal, his opponent, wanted to enter into Wimbledon winner’s circle after winning French Open for the 4th time. Sports Pundits referred to him as a clay court specialist (which is true as he holds 13 grand slams in clay surface!). He was chasing a French Open - Wimbledon double which was rare feat to achieve as it required player to switch from clay to grass surface.
Final turned out to be a classic 4 hr 48 mins marathon, its considered to be amongst the best matches witnessed in tennis history. Nadal prevailed, resulted in a great rivarly which continued for decades.
Novak Djokovic on the other hand just won his first slam that year, Australian Open. He was the first Serbian to win a grand slam (he currently owns 9 titles in AO). 2011 he started started winning more slams, defeating Roger and Rafa in many occasions, he now has 19 slams, and is one slam shy of tying with Roger and Rafa. Today they are referred to as “The Big 3” of tennis world, sharing total of 59 slams !
“I fear no one but respect everyone.” - Roger Federer
“If you don’t lose, you cannot enjoy the victories.” - Rafael Nadal
“Your belief should be stronger than your doubt.” - Novak Djokovic
Data Analytics Idea
Analyzing golden era of tennis using data analytics was a best use case to explore web scraping. It made sense to start with a smaller dataset and gather total grand slam titles won by these players every year. To further build a race chart showcasing their career progression and succession to the top as The Big 3. After considering several alternatives, best course of action was to use Python as the preferred language to tell this story.
And here is the story ! Slam race from year 2000 - 2021.
Tennis Grand Slams
| Name | Total Titles |
|---|---|
| Roger Federer | 20 |
| Rafael Nadal | 20 |
| Novak Djokovic | 19 |
| 59 |
Why Beautiful Soup?
 In order to simulate an accurate trend visual, it was important to gather players career data from a reliable source. In this case was it was ATP site. This online repository has wide range of historical data for all tennis players. Challenge here was to seamlessly navigate content through the site pages and get desired extracted intormation. Enter Beautiful Soup ! For a quick analytics project turnaround and to scrape literally anything developers give to in-built parser, this library provided by Python is the most diverse package one can ask for, because :
- Beautiful Soup makes page’s tree traverse and searching easy.
- This library automatically converts encoding types to best suit developer’s need.
- This library sits on top of other Python libraries like lxml and html5lib.
Plenty of big data and data science projects from time to time requires web scraping, and Beautiful Soup library helps developers with that process. Interesting fact, the name of the package was adapted from a song in Alice’s Advantures In The Wonderland
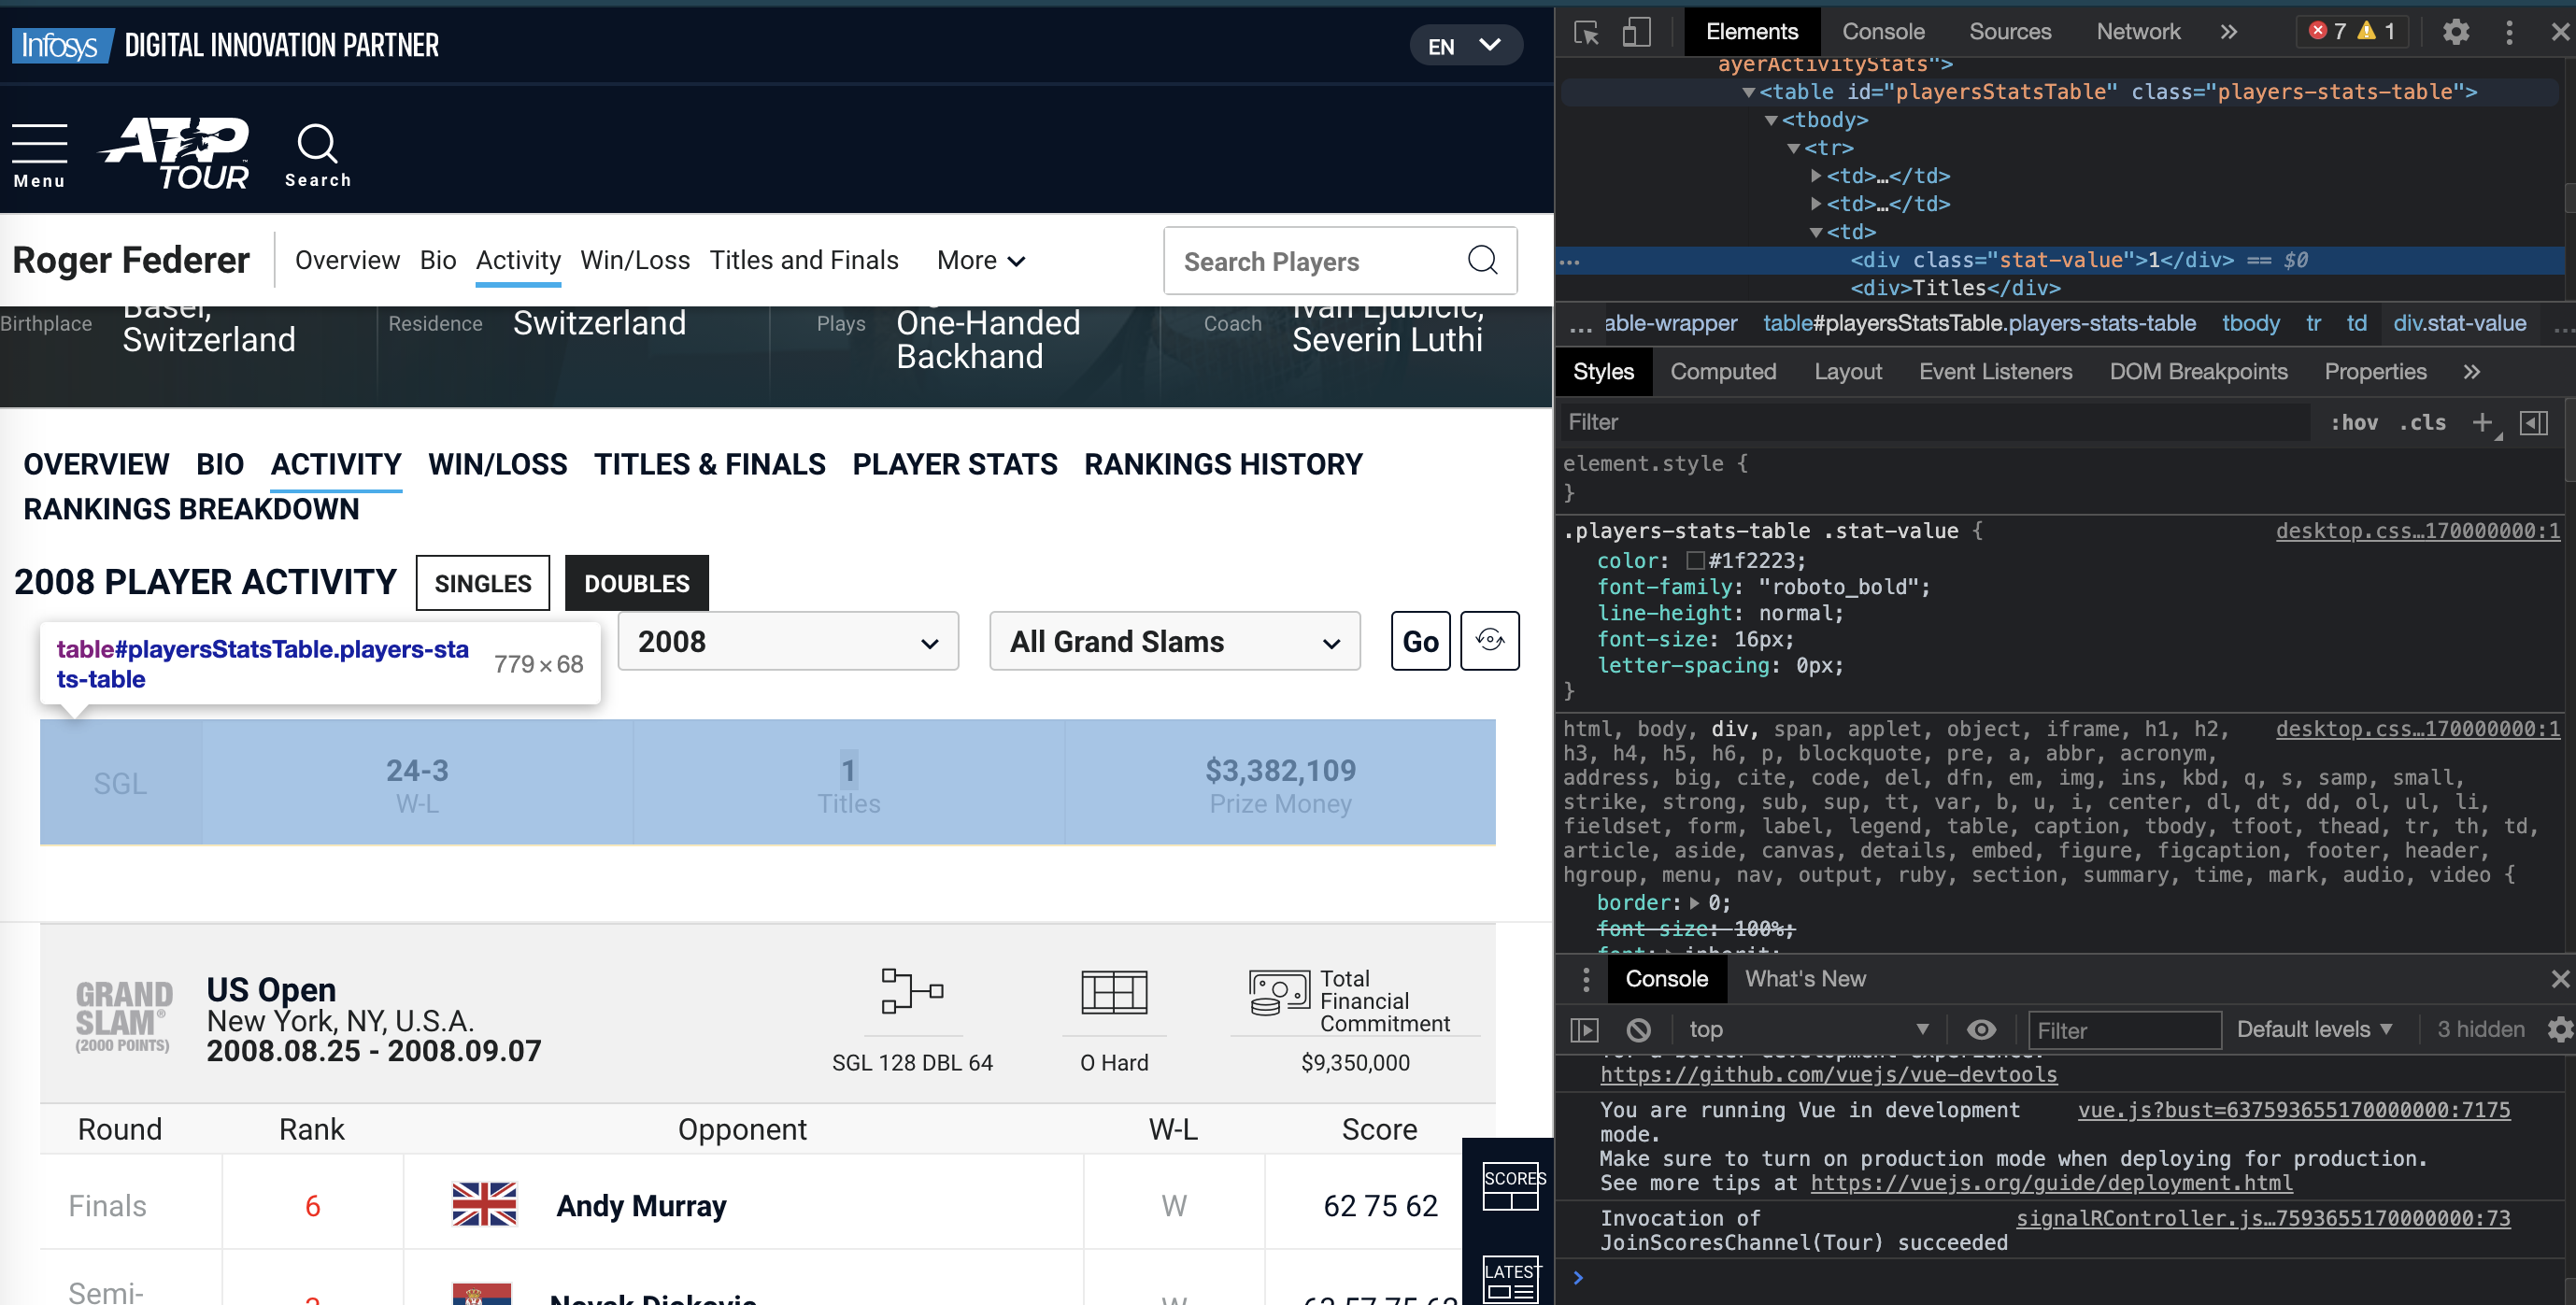
Inspecting Web Page
Key to gathering information from web is understanding tree structure of your target webpage. Understanding of page tree elements helps to extract information such as CSS, DOM, query pattern, HTML table content and other elements part of the page. Developers can use any browser tool to get HTML content view, I recommend Chrome’s Inspect feature. Right click on the browser and select “Inspect”, it opens up developer tool window displaying HTML content. It gets easier to explore and skim down to desired information.
Data Manipulation & Visualization
Extracting data from a site majority of time would also require data cleansing and transformation for analytics and visualization purpose. Example in this article uses pandas, bar_chart_race and pandas_alive libraries to achieve transformation and visualization steps.
Implementation Steps
- Install required packages using
pip install - Initiate URL connection request using
requestlibrary - Use beautiful soup library to find html content from the page
- Store extract in Dataframe using
pandas - Use race chart and pandas_alive library to create a gif image and mp4 video extract
Comments
Join the discussion for this article on this ticket . Comments appear on this page instantly.