ThoughtSpot : BI Analytics
ThoughtSpot enters into Gartner Quadrant with its search based AI driven analytics
![]()
![]()
Gartner Magic Quadrant & ThoughtSpot
IT Professionals working with Business Intelligence tools in various ecosystems are familiar with Gartner and its magic quadrants. Technology leaders in data analytics space land into different quadrants based on product's current state of maturity. These quadrants comprises of "Leaders", "Challengers", "Niche Players" and "Visionaries". Microsoft is currently leading this space in "Leaders" quadrant with Power BI tool followed by Tableau , Qlik and latest entry into this quadrant is a tool called ThoughtSpot.
As per Gartner : As disruptive as visual-based data discovery has been to traditional BI, a third wave of disruption has emerged in the form of augmented analytics, with machine learning (ML) generating insights on increasingly vast amounts of data. Augmented analytics also includes natural language processing (NLP) as a way of querying data and of generating narratives to explain drivers and graphics.
ThoughtSpot Architecture
Overview
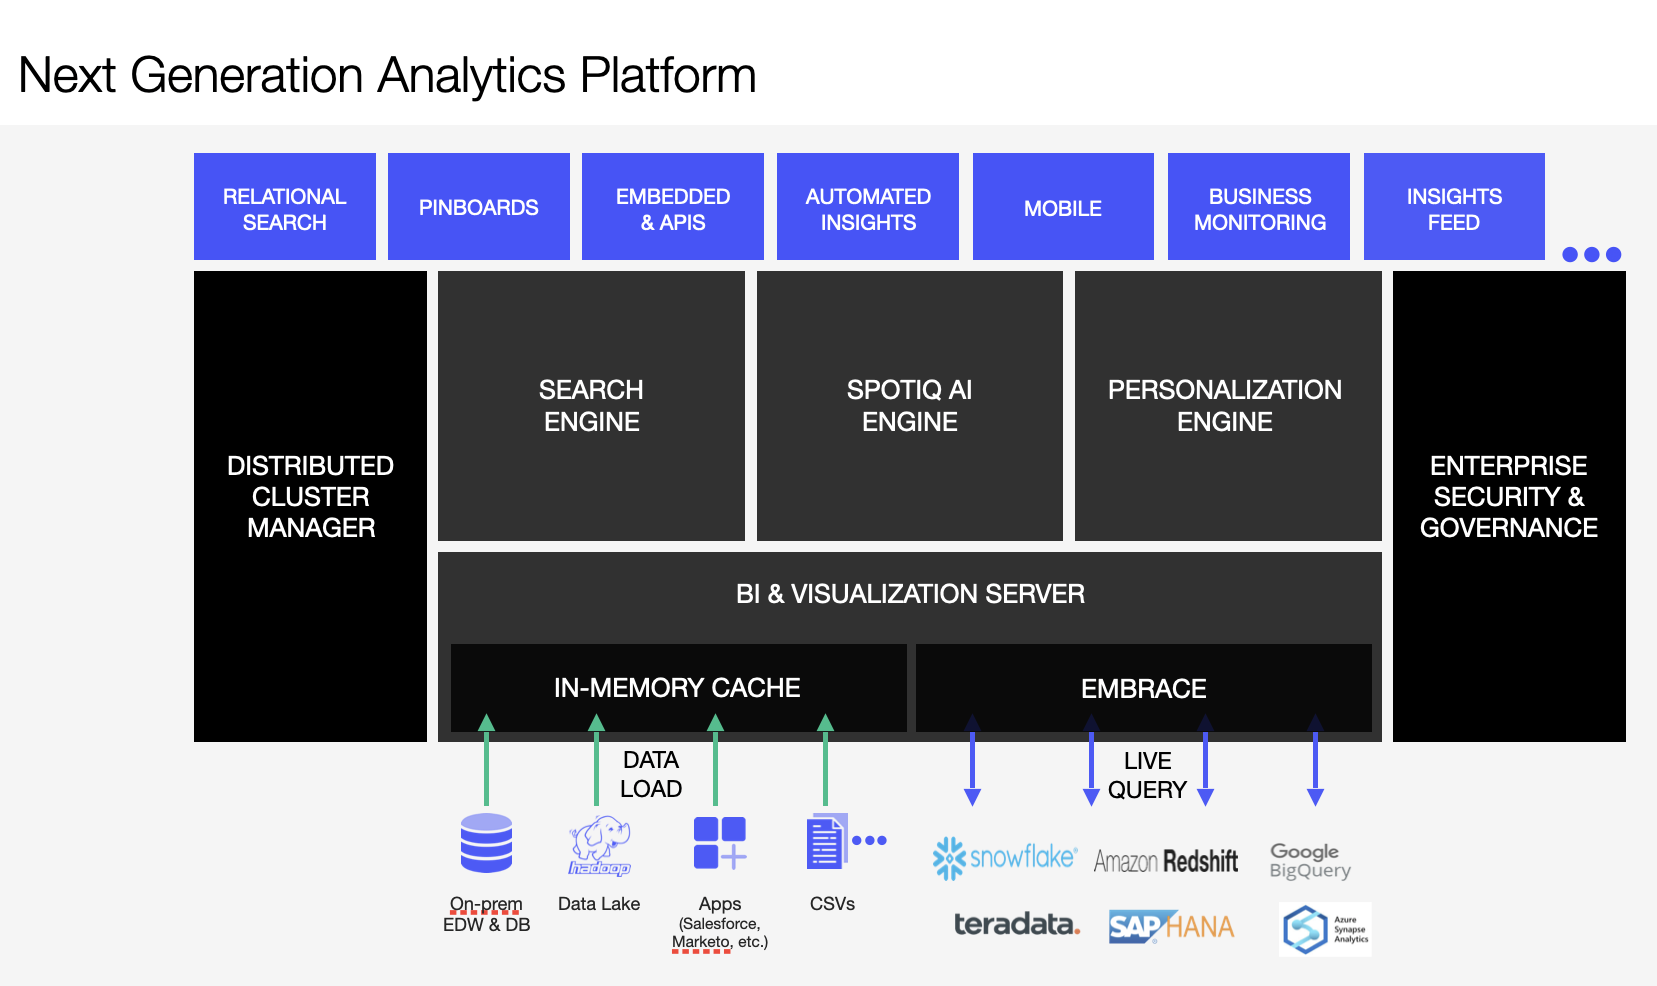
ThoughtSpot consists of a cluster of one or more nodes, acting together to provide analytic answers to business questions. As such, there are only a few integration points with ThoughtSpot on your network. The major components in the a ThoughtSpot cluster are shown above.Infrastructure can be scaled in ThoughtSpot horizontally or vertically through adding distributed clusters and nodes to the cloud instance or phycial instance to support fast responsive analytics platform. You can leverage AWS, Azure or GCP as the cloud platform to deploy your ThoughtSpot platform. Components in blue highlights different capabilities ThoughtSpot offers such as "Search" tool , Pinboards, SpotIQ etc. Driven by AI engine to drive usage based ranking for analytics recommendation
Tool Highlight
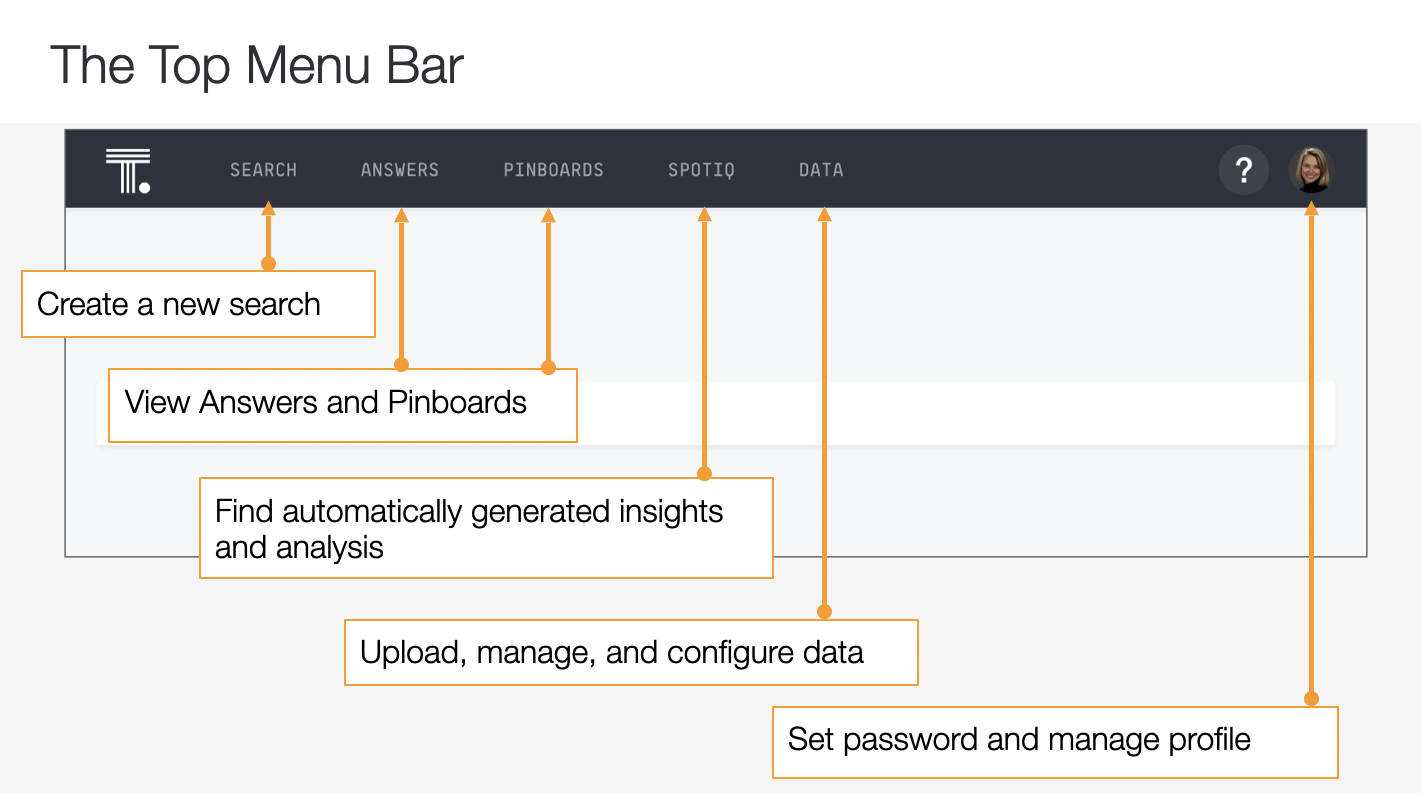 ThoughtSpot Menu Options consists of : Search, Answer, Pinboard, Data, SpotIQ and Admin Tabs.
Search :
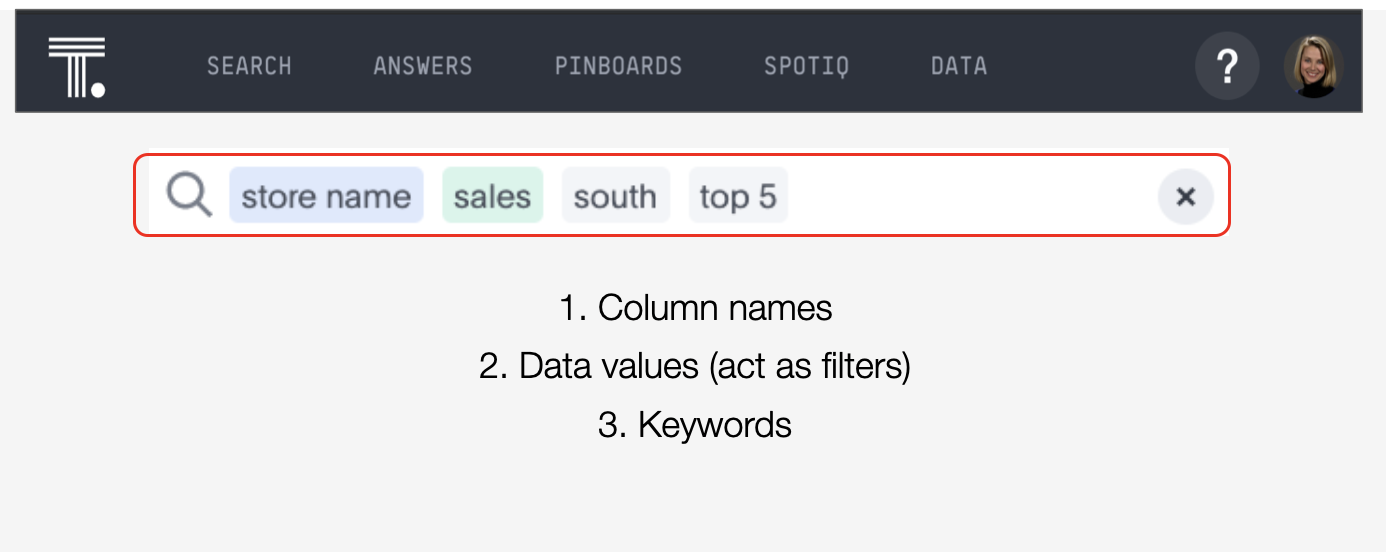 Search feature helps create Answers and Pinboards. Source is used in the form of Worksheets, Views and Raw Tables. Search capability is extremely intuitive and can find data fields from the sources automatically within search bar. Tool automatically generates most apt visual for data representation, but also gives flexibility to pick the visual of your choice in chart configuration section. If users like their search results, those searches can be saved in the form of "Answers", users can pin collection of visuals into a consolidated "Pinboard". Owners of Answer or Pinboard contents can share these objects with other members by assigning them view or edit permissions. Users can also perform complex nested searches, this search within a search functionality can account for complex business questions.
Answers & Pinboards:
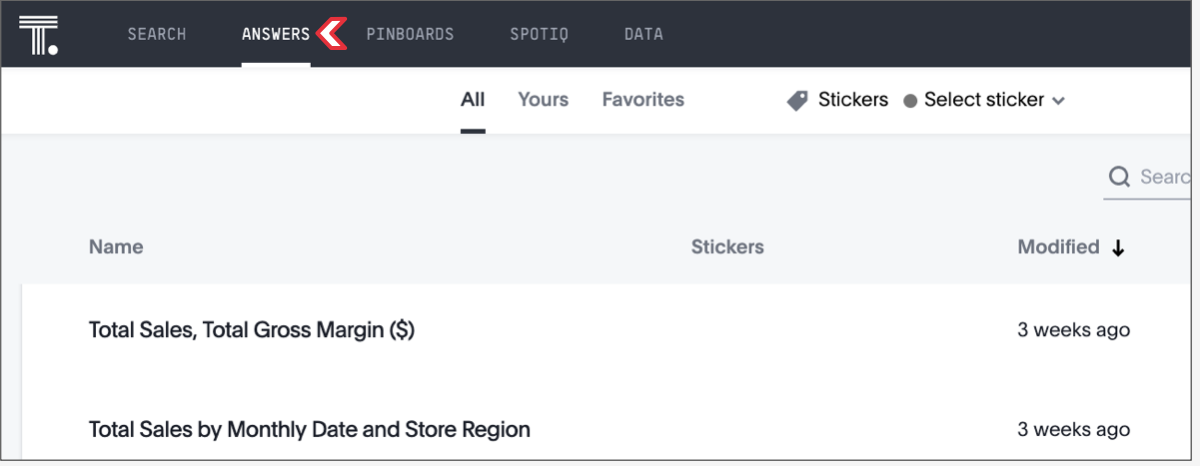 Answers and Pinboards tabs are collection of all saved Searches. Answers can also be transformed into Materialzed Views, these views can be scheduled for refreshes and can directly sourced in a Worksheet. This provides end users flexibility to reuse their existing analytics contents. Pinboards contains collection of meanigful visuals that are saved within Answers. Pinboards main advantage is that user's analysis can span across multiple back end sources and can be represented in form of a single collection. Answers and Pinbaords, or any data object within Thoughtspot can be organized by leveraging stickers. Using Stickers analytics content can be managed by categories such as line of business, or subject areas that analytics team is accustomed to classify their business process. Another capability called "Ask an Expert" feature lets business users ask technical questions about the data in use to the data owner of the content.
SpotIQ:
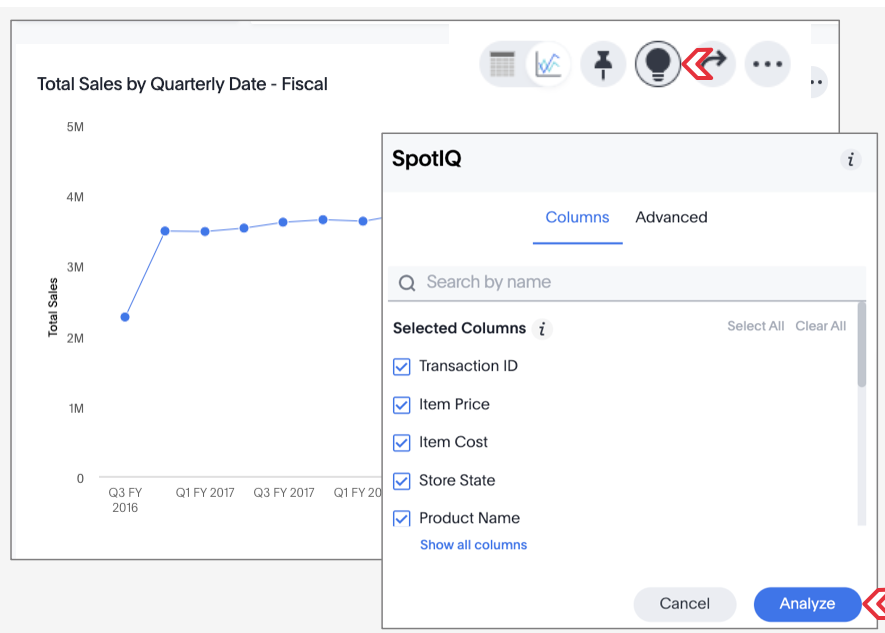 SpotIQ is AI/ML feature that ThoughtSpot has built for users to get more insights into their existing search/answers. SpotIQ will provide several recommendations and also give data visuals on comparisons such as Linear/Logistic Regressions on the searched data. SpotIQ based data representations can be used in Pinboards is an added plus.
Conclusion
ThoughtSpot is attracting data analytics enthusiasts from leading industries. It's highlight feature of being a Search Based Analytics tool (augmented analytics) with a strong recommender system is catching attention across industries. As ThoughtSpot continues to diversify its capabilities further, currently its emphasis is on reporting on cloud datasource, however ThoughtSpot should try to expand data connections to other conventional data sources that industries are familiar with and using at large scale. Also emphasizing on adding more visuals will go long way to compete with competitors PowerBI, Tableau and Qlik. Dataflow is getting there with managing ETL processes internally for the tool, but needs to mature more. Also some level of maturity is needed to improving error classifications for debugging and troubleshooting.
If your data analytics team is transforming into cloud ecosystem then this tool should be considered best option you got apart from PowerBI, Tableau, and Qlik. Data preparation and data load within TS is a topic of discussion for some other time. Overall a thumbs up to this reporting tool and highly recommend fellow data experts to leverage this tool within their industry in some fashion.
Comments
Join the discussion for this article on this ticket . Comments appear on this page instantly.