Customer Sentiment Analysis Using R
This article uses R Language to showcase API interactions using Markdown
![]()
![]()
Background
I am fairly new to R and have been exploring several use cases where I can leverage R language as a preferred reporting platform for data analytics compared to other BI tools I am familiar with. I eventually did find a great use case, it was conducting exploratory data analysis on customer reviews for local Pizza Restaurants ! Industries are assigning several customer sentiments based analytics projects to their team of data engineering and data science experts. Targeting sources from many social media platforms such as Facebook, Twitter, Zomato and Yelp. One of the ways data extraction can be performed is via REST APIs. BI ecosystem leveraging these API calls can then be utilized for tracking data around customer sentiments and help identify negative sentiments ; based on gathered results from this process, business can then make important decisions and take suitable action towards proper resolution. The biggest question one may have. Why analysis on Pizza Restaurants? Below quote says it all.
Never sit around and wait for someone unless they’re delivering a Pizza ! 😁
R Markdown
 As a developer do you want to save time creating online content so that you can focus on some real complex coding around data analytics? Markdown just might be the right blend which can help you save time. Through less usage of tags in your code, but resulting in same look and feel resembling a HTML document, I prefer using R Markdown. Certainly I can spin my reasoning several ways technically, around why markdown is better than HTML. Looking quick for easy way to represent their data on web? Then I highly recommend using this language.
R Markdown specifically was designed towards focusing on “seamless” coding experience for developers. A quick yet effective approach for projecting data and visuals on web without using complex HTML coding. Year 2012 this language was first introduced in “knitr” package.
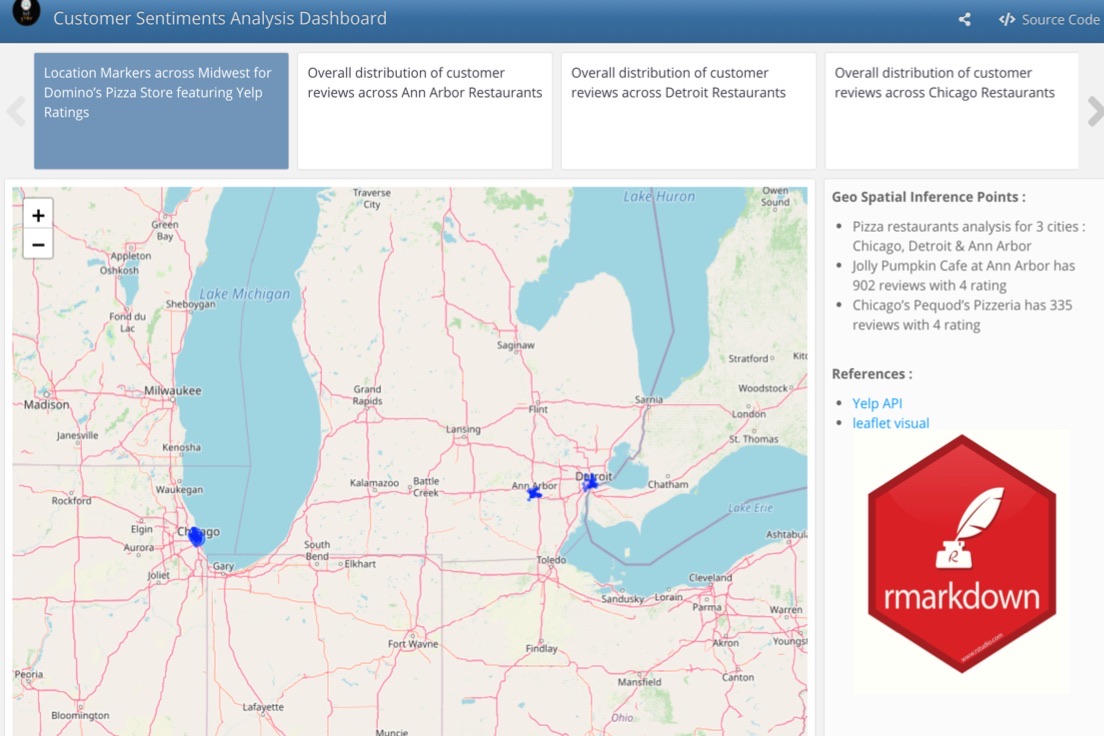
Customer Sentiment Dashboard
A great presentation feature that IDE tool R Studio offers is Flexboard. Using Flexboard authors can embed their R code chunks and interactive html widgets together into an appealing web based dashboard. Please feel free to interact with Customer Senimtent Analysis Dashboard embeded below, it uses Openstreet Map for projecting metrics around customer reviews and ratings on local restaurants. Dashboard also uses interactive Scatter Plot. As you will observe in this article, I have personally enjoyed user interaction that flexboard feature provides.
Code Summary
Implementation Steps
- Importing R Packages
- Yelp and Zomato API Call
- Storing json data into Dataframe and writing it into csv file
- Using visual packages (leaflet and highcharter) to project extracted information
Importing R Packages
Highlighting packages used for building this dashboard, starting with Flexboard for presentation, followed with tidyverse for data wrangling. httr, jsonlite, rlist and stringr are used for API and data transformation to add json data into dataframes. Visual packages such as highcharter, leaflet, DT and Shiny are used for outlining data. Finally, romato is a git package that is built for integrating with Zomato API. You can install these packages from CRAN repositories, or within terminal use install.packages()
API Calls
Selected Yelp and Zomato API stack as the source to retrieve Json data for analytics. You can create a developer account and obtain your client id along with client secret, these parmeters will help to authenticate to use API packages. This example references v3 business api query against Yelp and stores json data into a business_data Dataframe. Similarly , romato R API package takes query, latitude and longitude as parameters and returns back review data.
Visualizations
There are two visuals, leaflet and highcharter used for representation of data. ```{r} is what denotes a R code chunk. *** is the start position of information card shown next to visualizations consisting of markdown syntax
Key Takeaways
Working through coding of CSA project, along with writing a Dε∇gY@π blog was productive exercise. Hope this article on R Markdown has shown readers true potential of what open source platform such as R can offer. I am curious how large scale implementation of such BI ecosystem would look like; representing visualizations and using R Markdown presentations is very much in the realm of possibilities. Gathering data from web sources using API call isn’t a new concept, however, utlizing R presentations to showcase your business story is probably not advertised as strongly as it should from BI practitioners
Comments
Join the discussion for this article on this ticket . Comments appear on this page instantly.